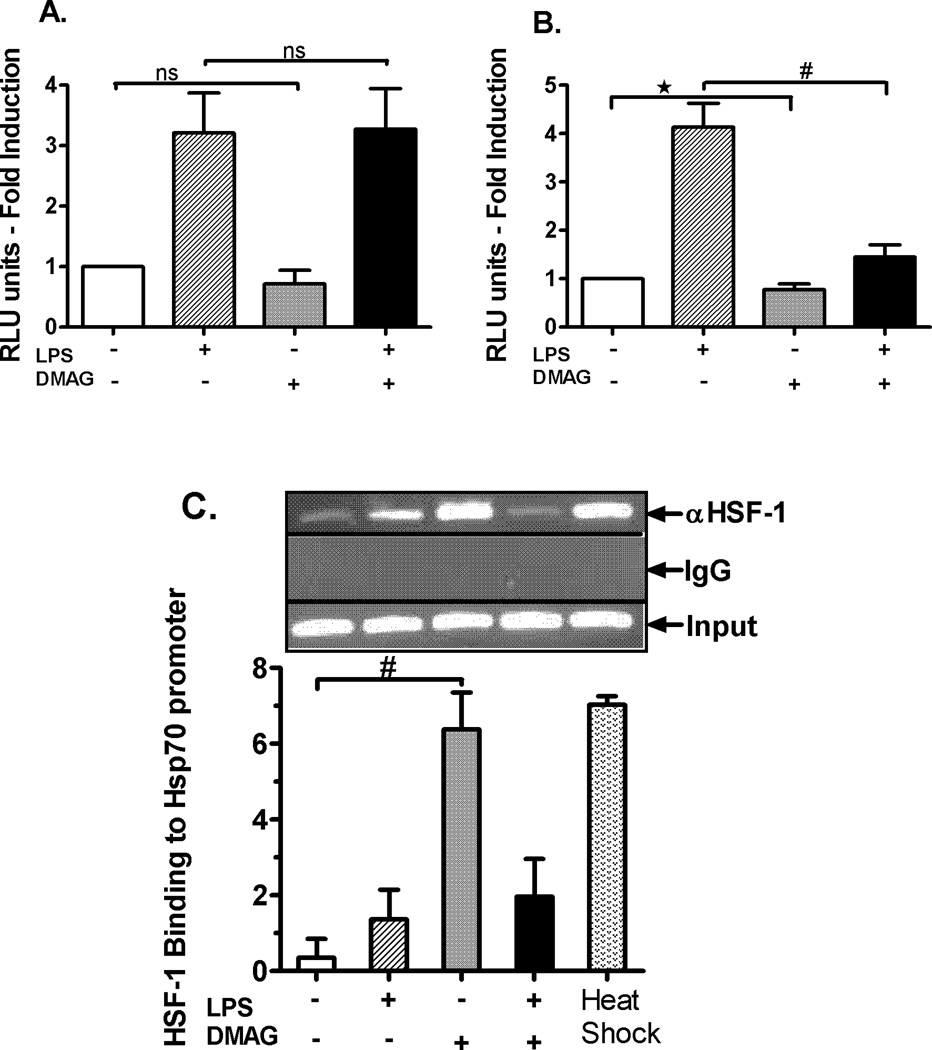
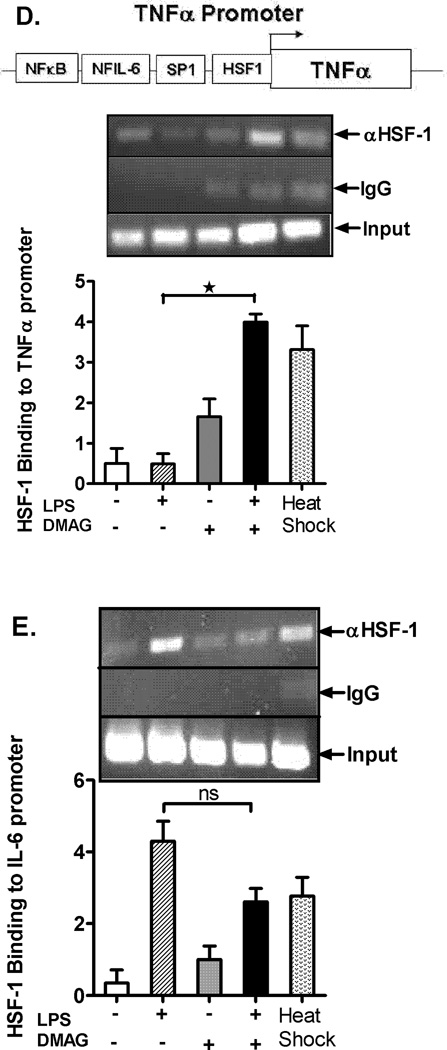
Fig. 5. HSF1 regulates TNFα and hsp70 expression in response to hsp90 inhibition.
RAW macrophages were transfected with either NFκB (A) or TNFα (B) promoter constructs separately. Next day the cells were stimulated with LPS ( 100 ng/ml), 17-DMAG (
 0.5 µM) or both (
 ) for 6 hrs. Fold induction in NFκB (A) and TNFα (B) promoter activity over unstimulated cells is shown as bar graph. *p < 0.05 vs. unstimulated cells, #p < 0.001 vs. LPS stimulated cells. Data represents mean of 3 experiments ± SEM. Chromatin immunoprecipitation assay was performed using anti-HSF1 antibody and semi quantitative PCR was carried out using hsp70 (C), TNFα (D), and IL-6 (E) promoter specific primers. A representative gel picture for each gene is shown. The densitometry graph represents average of 3 independent experiments. *p < 0.0001 vs. LPS stimulated cells; #p < 0.001 vs. unstimulated cells.


