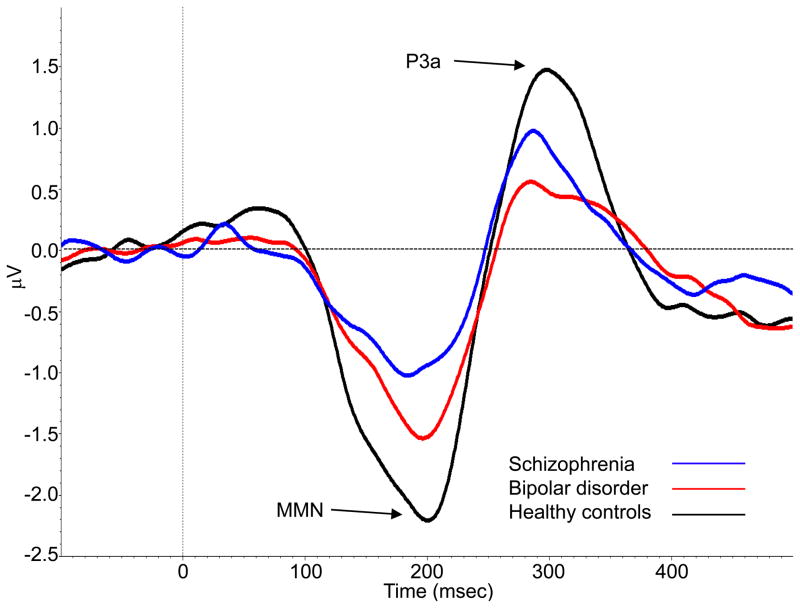
Fig. 1.
Grand average mismatch negativity (MMN) and P3a waveforms for patients with bipolar disorder (red), patients with schizophrenia (blue), and healthy controls (black) at the midline region. MMN was measured as the mean activity between 135–205 msec and P3a was measured as the mean activity between 250–350 msec.

