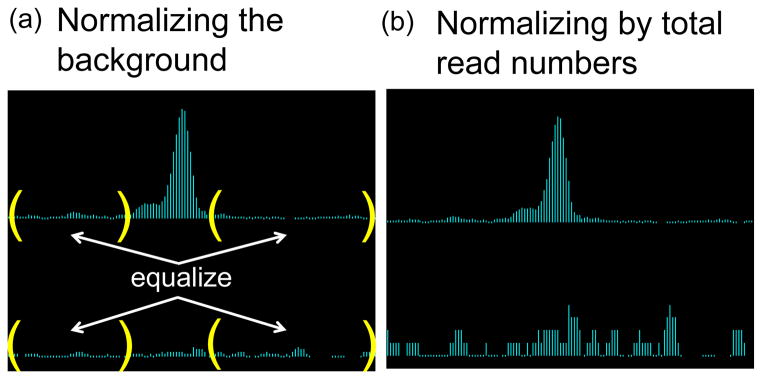
Figure 2. Comparison of scaling methods.
(a) Scaling IP (top row) and Input (bottom row) samples to equalize the read counts only in the background (enclosed by parentheses) preserves the statistical significance of the IP peak shown. (b) On the other hand, forcing the total number of reads to be equal between IP and Input would artificially redistribute the counts that accumulated within the IP peak to background regions, thus inflating the noise level in Input. Some true peaks can be lost in this process.

