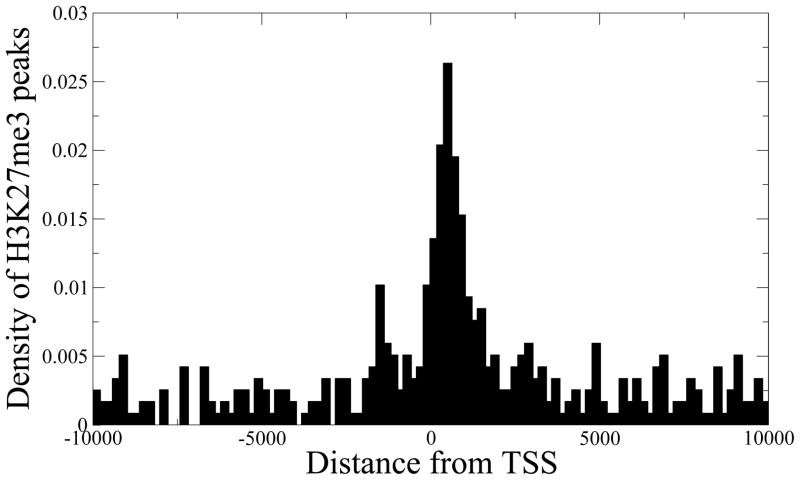
Figure 6. SES preserves subtle H3K27me3 peaks.
The majority of the H3K27me3 peaks detected by our method, but missed by PeakSeq, are found near transcription start sites (TSS) of known genes. The corresponding genes also show significantly lower expression levels compared to the genes that have H3K4me3 peaks (Wilcoxon test p-value = 1.3 × 10⁻²⁵).

