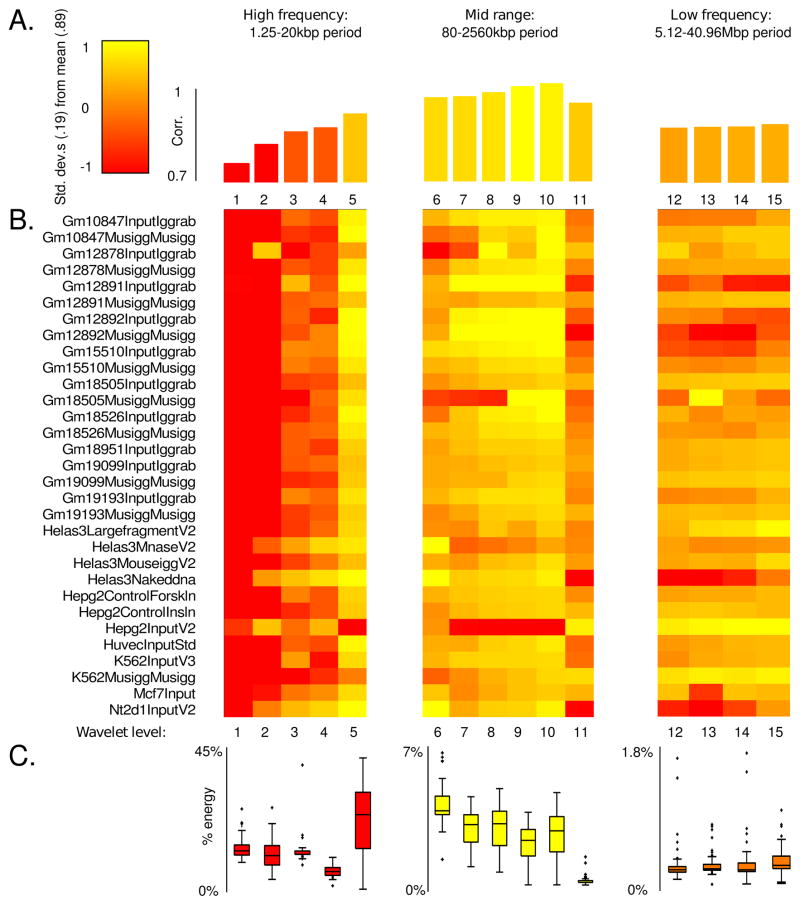
Figure 7. Frequency correlation and spectral energy for ChIP-seq replicates.
Level 15 Coiflet wavelet decompositions were performed on the alignment densities for each replicate experiment pair in the ENCODE Yale TF Input dataset. At each level we computed the Pearson correlations of the detail coefficients, as well as their spectral energy. (A) The average correlation over all datasets, at a given wavelet level. Over all datasets, over all levels, the mean correlation was 0.89 with a standard deviation of 0.19. (B) Correlation between replicates at a given wavelet decomposition level. (C) Percentage energy allocated to a given level, averaged over all experiments. Each box summarizes the distribution of spectral energies across datasets, at a given level.

