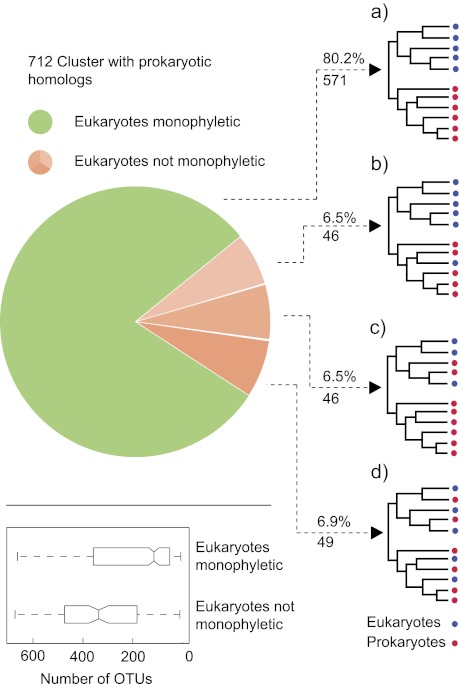
Fig. 1.—
A distribution of topologies among 712 inter-kingdom trees. The schematic trees on the right symbolize the branching patterns of eukaryotic and prokaryotic species observed in each category. (a) Eukaryotes and prokaryotes form monophyletic clades. (b) Eukaryotes are polyphyletic (≤6 eukaryotic species branch within the prokaryotic clade) and prokaryotes are paraphyletic. (c) Eukaryotes are paraphyletic (between 1 and 22 prokaryotic species branch within the eukaryotic clade) and prokaryotes are polyphyletic. (d) A mixed topology of eukaryotes and prokaryotes. The boxplots in the lower panel show the distribution of the number OTUs in trees where the eukaryotes are 1) monophyletic or 2) not monophyletic.

