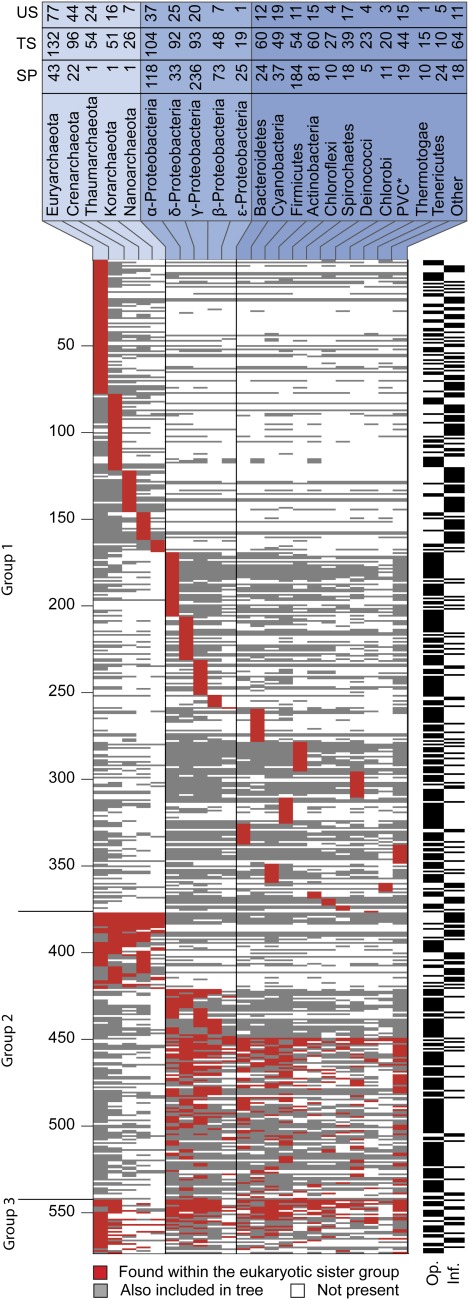
Fig. 2.—
A presence–absence pattern (PAP) of the bacterial taxonomic groups in trees supporting the eukaryotic monophyly. The rows correspond to 571 trees in which the eukaryotes were monophyletic, the columns correspond to 22 bacterial groups. A cell i,j in the matrix is colored if tree i included a homologue from bacterial group j. Taxonomic groups harboring a gene that branches as a nearest neighbor to the eukaryotic clade in each tree are marked by a red cell. Taxonomic groups that are also present in the tree are marked by a gray cell. An asterisk indicates that species from the Chlamydiae, Verrumicrobia, and Plancomycetes taxa were combined into one group (PVC) (Wagner and Horn 2006). Group 1 included only trees where exactly one bacterial group was found, Group 2 included trees where 1) only Archaea were found, 2) only proteobacteria were found, and 3) were only eubacteria were found. Group 3 included all other trees. The black and white bars on the right indicate whether the KOG underlying the tree belongs to an informational (Inf.) or to an operational (Op.) class (Rivera et al. 1998). The numbers in the top panel indicate the following. US: The number of times that the given taxon was the only taxon in the sister group to the eukaryotic sequence (unique sisterhood, US). TS: the number of times that the taxon was either included in a unique sister group or in a sister group consisting of mixture of prokaryotic taxa total sisterhood (TS). SP: the number of sequenced strains from that taxon in our genome sample.

