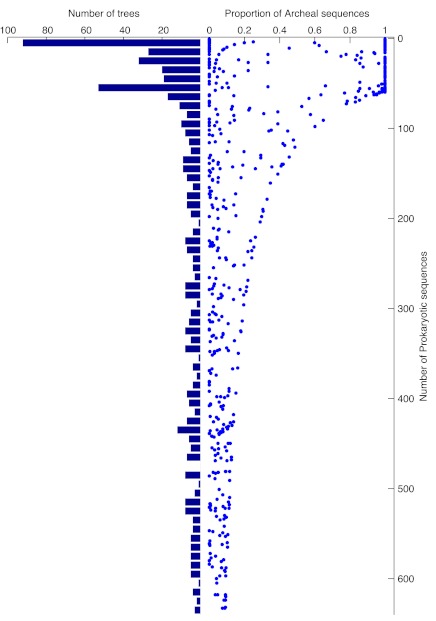
Fig. 3.—
Proportion of archaeal sequences per alignment in the data set. The left bar graph shows the distribution of bacterial sequences in all trees where the eukaryotes form a monophyletic clade in bin intervals of 10. The plot on the right indicates the proportion of archaeabacterial sequences in each tree. There were only 68 archaea in the data, hence a skew distribution of trees containing many or mostly archaeabacterial sequences versus eubacterial sequences in alignments with more than 68 OTUs (see also fig. 4).

