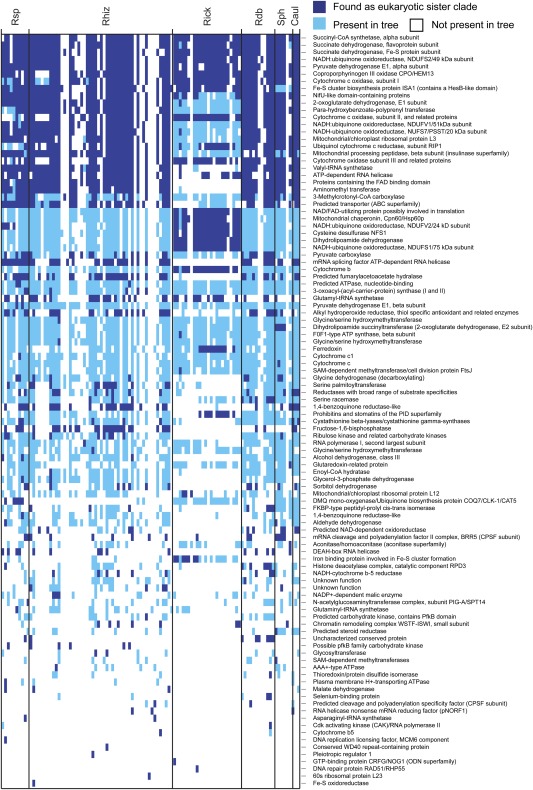
Fig. 7.—
Distribution of α-proteobacterial groups found as sister group to the eukaryotic clade. These presence absence matrix gives the functional description of all 104 trees (as rows) where the α-proteobacteria (106 different species, as columns) were found as the eukaryotic sister clade. The color indicates whether a group was found as sister clade (deep blue) or was just present in the tree (light blue). Abbreviations of α-proteobacterial families as given in the legend to figure 6.

