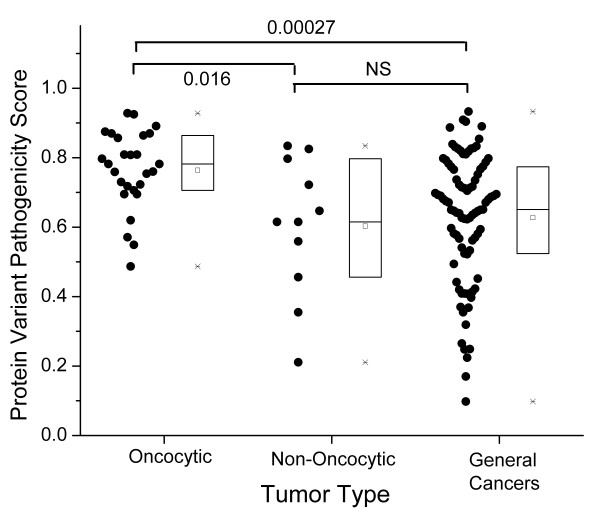
Figure 1.
Pathogenicity scores of mtDNA variants in oncocytic, non-oncocytic, and general cancers. Each point represents a somatic mtDNA mutation resulting in a single amino acid change. In each category, individual data points are given to the left, and the statistics of the distribution are given in the bar chart to the right (square = mean, line = median, box = second and third quartiles, asterisk = max and min data values). P values are from nonparametric Wilcoxon rank sum tests. With three tests, the significance threshold is 0.05/3 = 0.017

