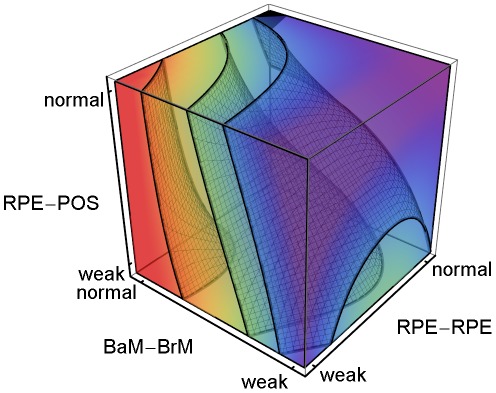
Figure 13. Stable Type 2 CNV dependence on adhesion.
3D plot of the regression-inferred probability of occurrence of Stable Type 2 CNV (S22 CNV probability) using 10 simulation replicas for each adhesion scenario in the 3D parameter space obtained by setting RRp = RRl and RBp = RBl. Red corresponds to a S22 CNV probability of 1 and purple corresponds to a S22 CNV probability of 0. The black region at the top-back corner indicates the locus of normal adhesion. The three isosurfaces correspond to S22 CNV probabilities of 0.25 (right), 0.5 (middle) and 0.9 (left). The five parameters and their (multi)linear combinations account for 89% of the observed variance in the probability of occurrence of S22 CNV in all 108 adhesion scenarios (adjusted R 2 = 0.84 ). S22 CNV occurs primarily when RPE-RPE junctional adhesion is moderately to severely impaired, RPE-BrM junctional adhesion is normal or moderately impaired, independent of RPE-POS labile adhesion (red region with S22 CNV probability>0.9). The red region does not include all adhesion scenarios in Table S8 leading to S22 CNV. To show the structure of the isosurfaces, we have rotated the axes relative to Figure 3.

