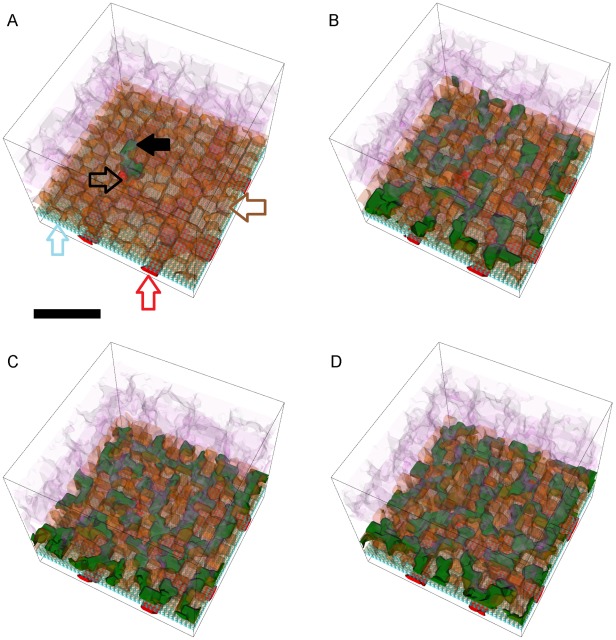
Figure 15. Snapshots of a simulation replica showing stable Type CNV (S22 CNV).
3D visualization of a simulation replica showing S22 CNV in one simulated year (RRl = 1, RRp = 1, RBl = 3, RBp = 3, ROl = 3) (adhesion scenario ID: 16, simulation ID: 556). Snapshots of the simulation at months 1 (A), 2 (B), 6 (C) and 12 (D). (A) Stalk cells (solid black arrow) invade the sub-retinal space through a hole in BrM (black outline arrow) and form a partially developed capillary network (B). CNV finishes sub-retinal invasion around month 5 and remains in the sub-retinal space throughout LT2 CNV (C–D). A few vascular cells (A, black outline arrow) fill the hole in BrM to connect the CNV capillaries to the CC (red outline arrow). Brown outline arrow shows an RPE cell. Cell type colors: 1) POS and PIS: light purple, 2) RPE: brown (stalk cells in the sub-retinal space have lighter shading), 3) Stalk cells: green, 4) Vascular cells (CC): red, 5) BrM: light blue. Scale bar ∼50 µm. We have rendered the boundaries of individual cells as semi-transparent membranes. POS, PIS and RPE cells are more transparent to show the underlying structures. See also Video S4.

