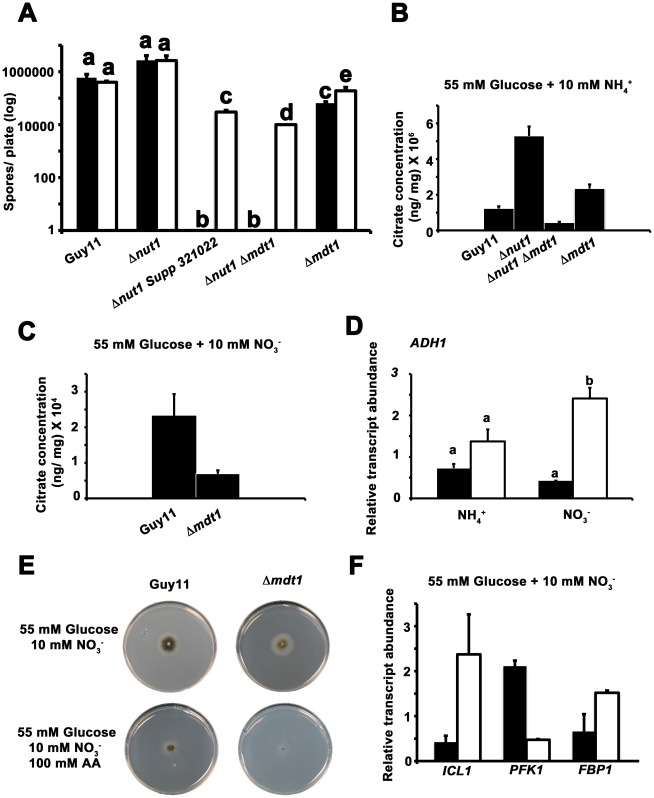
Figure 12. Elucidating the function of the Mdt1 efflux protein.
(A) Sporulation of the Δnut1 Supp 321022 suppressor strain, the Δnut1 Δmdt1 double deletion strain, and the Δmdt1 single deletion strain, but not the Guy11 or Δnut1 parental strains, was significantly increased (Student's t-test p≤0.05) on minimal media comprising 55 mM glucose and 10 mM NH4 + and containing ten-fold more zinc (open bars) than the same media with standard zinc concentrations (closed bars). Spores were harvested from plates following 12 days of growth. Log scale is used. Values are the average of three independent replicates and error bars are the standard deviation. (B) Strains were grown in CM for 48 hr before switching to minimal media with 55 mM glucose and 10 mM NH4 + or (C) 10 mM NO3 − as sole nitrogen sources for 16 hr. Citrate was measured in the media using LC-MS/MS and quantified against known concentrations of citrate. Values are the mean of at least three independent replicates. Error bars are standard deviation. (D) ADH1 gene expression was analyzed in strains of Guy11 (closed bars) and Δmdt1 (open bars) after 16 hr expression in minimal media with 10 mM NO3 − or 10 mM NH4 + as sole nitrogen source, and 55 mM glucose as carbon source, following a switch from CM media. Gene expression results were normalized against expression of the ß-tubulin gene (TUB2). Results are the average of at least three independent replicates, and error bars are the standard deviation. Bars with the same letter are not significantly different (Student's t-test p≤0.05). (E) Δmdt1 strains are carbon derepressed on minimal media with 55 mM glucose+10 mM NO3 − and show increased sensitivity to 100 mM AA on this media compared to Guy11. Strains were grown for 5 days on 85 mm plates. (F) Compared to Guy11 strains, growth of Δmdt1 strains on minimal media with 55 mM glucose+10 mM NO3 − results in changes to ICL1, PFK1 and FBP1 gene expression. Gene expression results were normalized against expression of the ß-tubulin gene (TUB2). Results are the average of at least three independent replicates and error bars are the standard deviation.

