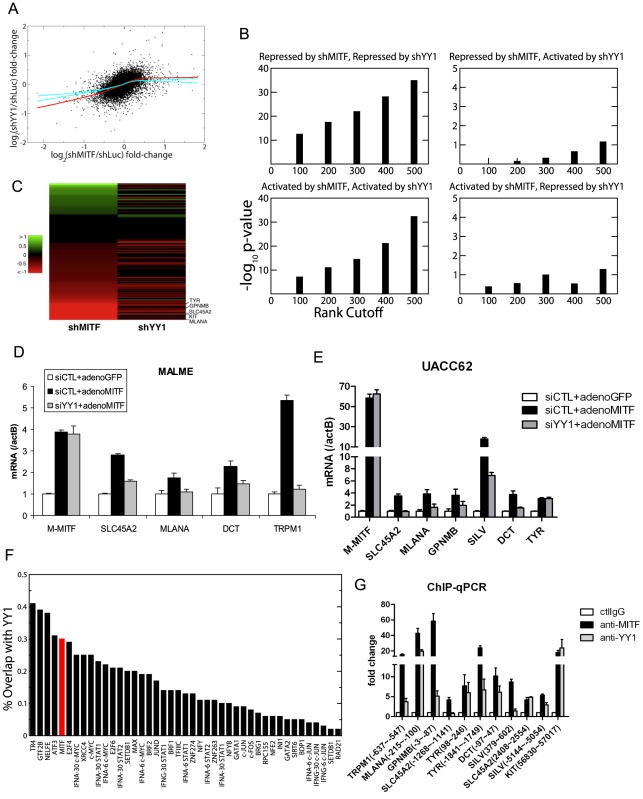
Figure 4. YY1 cooperates with MITF in gene transcription.
(A) Scatter plot of mean log fold-changes in MALME-3M and UACC62 cells treated with MITF shRNA (shMITF) and YY1 shRNA (shYY1) relative to the control (shLuc). The red line is the average of 100 lowess regression curves fitted to 100 bootstrap simulations. The cyan curves represent the upper and lower bounds of 1000 lowess curves fitted to the data obtained by randomizing the x-coordinates of differentially expressed genes after YY1-shRNA. The fact that the observed fit lies well outside the error bounds of randomized data in the lower left quadrant shows that YY1 and MITF co-activate a statistically significant number of common target genes. (B) Fisher's exact test p-values are plotted for the significance of the overlap between the top ranking differentially expressed genes after shMITF and shYY1, where the differential expression was ranked by RSA analysis p-values. Statistical significance is observed for genes that are either co-repressed or co-activated by MITF and YY1, but not for genes on which MITF and YY1 have antagonistic effects. (C) Gene Ontology analysis found 131 genes to play a role in melanosome function and pigmentation regulation. The heatmap shows the log expression fold-change of those 131 genes after MITF and YY1 knockdown. (D,E) Loss of YY1 inhibits M-MITF-dependent transcriptional up-regulation of multiple melanocytic markers. MALME-3M cells (D) or UACC62 cells (E) were transfected with 10 nM of YY1 siRNA (siYY1) or control siRNA (siCTL). After 24 h, cells were infected with adenovirus encoding cDNA of M-MITF or GFP at MOI 500 (D) or 100 (E). Cells were harvested 48 hours post infection. mRNA levels of the different genes were measured by RT-qPCR and normalized to β-actin (actB). Error bars represent s.d. of triplicates. (F) The fraction of transcription factor (TF) binding sites overlapping with YY1 was computed for 42 TFs mapped by the ENCODE consortium in the K562 cell line (black bar). The overlap between MITF binding sites in 501MEL and YY1 binding sites in MALME-3M (red bar) was 30%. (G) Co-localization of YY1 and MITF at the proximal promoter of multiple melanocyte differentiation markers in MALME-3M cells. ChIP-qPCR primer position relative to the transcription start site is indicated in brackets. Data are normalized to control IgG ChIP. Error bar represents s.d. of triplicates.

