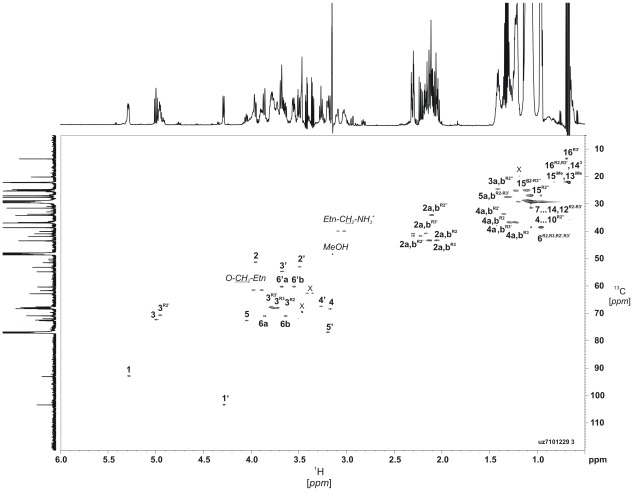
Figure 1. NMR analysis of the lipid A from C. canimorsus wild type.
1H,13C-HSQC spectrum (700 MHz) of lipid A in chloroform-methanol-water (20∶10∶1, v/v/v) at 27°C. The corresponding parts of the 13C and 1H NMR spectra are displayed along the F1 and F2 axes, respectively. Numerals refer to atoms in sugar and acyl chain residues denoted by letters as shown in Supplementary Table 1 and Fig. S2. Signals from an unidentified contaminating lipid are indicated by X.

