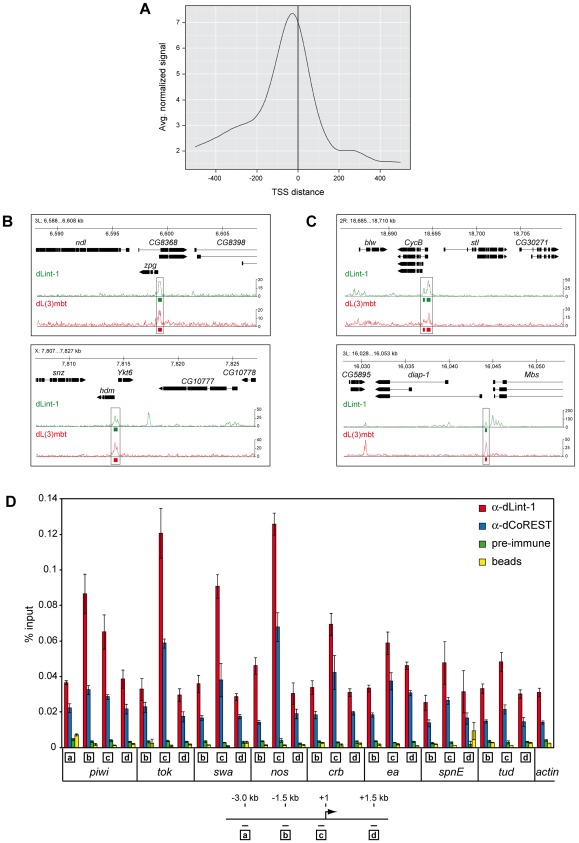
Figure 4. LINT binds to genes deregulated in l(3)mbtts brain tumours.
(A) Averaged dLint-1 ChIPseq signal intensity around those transcription start sites that are within 1 kilobase of a dLint-1 peak (normalized to 1 million tags). In cases where multiple TSSs were within 1 kb of a peak, the one with the smallest summit-TSS distance was chosen. (B) Genome browser view of dLint-1 and dL(3)mbt [4] chromatin association in regions containing MBTS genes (upper panel: zpg, lower panel: hdm). (C) Genome browser view of dLint-1 and dL(3)mbt [4] chromatin association in regions containing SWH target genes (upper panel: CycB, lower panel: diap-1). (D) Chromatin immunoprecipitation (ChIP) of Kc cell chromatin using dLint-1 #1 and dCoREST antibodies. As a control chromatin was precipitated with ProtG beads loaded with pre-immune serum or no antibody (beads). Genes analyzed are denoted below the panel. Amplified regions are indicated by boxed letters and had the following distances from the TSS as illustrated below: a, 3 kb upstream; b, 1.5 kb upstream; c, 0–0.15 kb (promoter); d, 1.5 kb downstream.

