Figure 5.
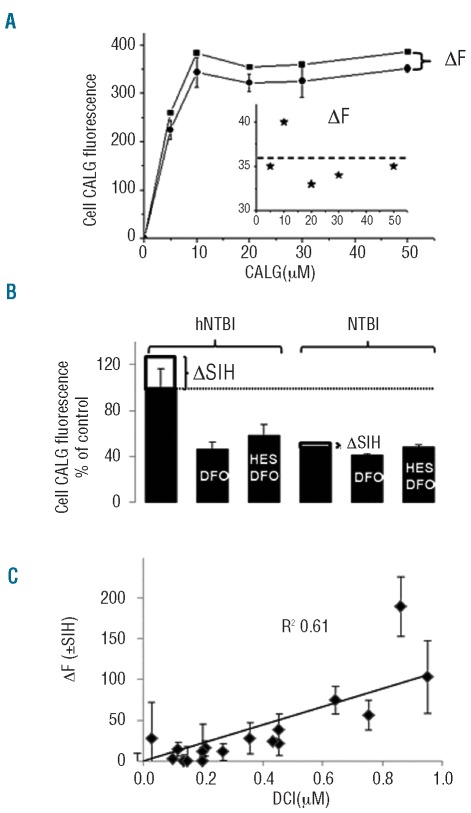
CALG uptake into RAW cells exposed to thalassemia major sera is dependent on concentration of CALG and NTBI. (A) RAW cells were incubated for 3 h in DMEM medium containing 30% high-NTBI thalassemia major serum supplemented with the indicated concentrations of CALG and the mean fluorescence intensity measured in cells was plotted against CALG concentration (circles). The fluorescence intensity, ΔF, following addition of SIH (squares) was plotted against CALG (inset). (B) The uptake of CALG was measured in RAW cells exposed for 3 h to 30% thalassemia major sera with low NTBI (lNTBI) and high NTBI (hNTBI), as indicated, which were supplemented with 20 μM CALG without and with 50 μM DFO or hydroxyethyl-starch-DFO (HES-DFO). Fluorescence measurements were taken before and after addition of SIH (ΔF corresponds to ΔSIH) and the mean cell CALG fluorescence of 4 cells per field (±SD, from 3 independent experiments) was calculated with Image J program. (C) Correlation between endosomal CALG-Fe acquired by RAW cells and NTBI levels detected in thalassemia major sera. RAW cells exposed to sera from thalassemia major patients (n=20) were examined microscopically after 3 h incubation before and after addition of SIH, as described in Figure 1 (where ΔF corresponds essentially to ΔSIH). The mean cell CALG fluorescence (± SD) associated with the endosomal compartment was calculated from 4 different cells in a given field. The increment in fluorescence following SIH addition (ΔF+SIH) was plotted against serum DCI (in μM; a measure of serum NTBI, see Design and Methods section) and analyzed by linear regression analysis (slope 132±30 fluorescence units per μM Fe; R2=0.61).

