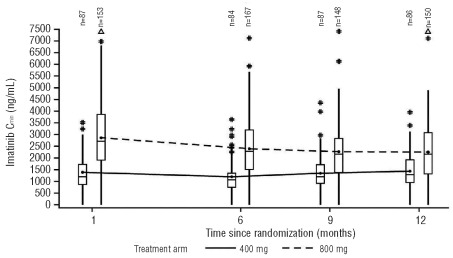
Figure 1.
Imatinib Cmin over time for the 400 mg/day and 800 mg/day protocol dose groups. Box plots show the median, 25th percentile, 75th percentile, and joined mean values. The whiskers extend up to 1.5 times the interquartile range from the boxes. #: values which exceed 1.5 times the interquartile range; Δ: values > 7500 ng/mL.

