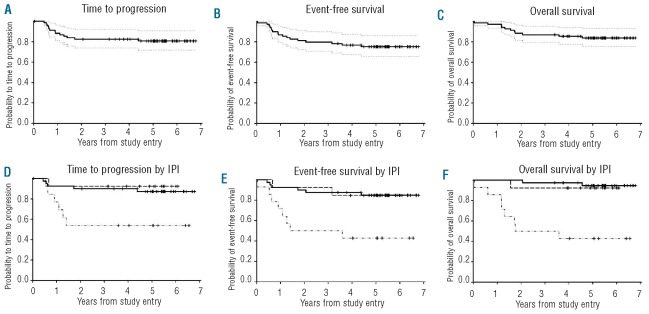
Figure 1.
Kaplan-Meier plots of survival outcomes of all patients. Outcomes are reported at 5 years (95% Confidence Interval (CI)) and CI range is shown on the curves. (A) PFS 81% (69, 88). (B) EFS 75% (63, 84). (C) OS 84% (73, 91). (D) PFS for IPI risk groups: low/low-intermediate (------------------------) 87% (72, 94), high-intermediate (- - - - - - - - ) 92% (57, 99) and high risk (--- . . --- . . --- ) 54% (25, 76) (P=0.0085). (E) EFS for IPI risk groups: low/low-intermediate 85% (69, 93), high-intermediate 85% (51, 96) and high risk 43% (18, 66) (P<0.0013). (F) OS for IPI risk groups: low/low-intermediate 95% (80, 99), high-intermediate 92% (57, 99) and high risk 43% (18, 66) (P<0.0001).

