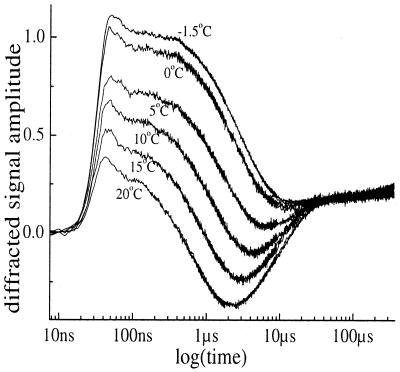
Figure 4.
The 7.5-μm temperature dependent data with the following temperatures from bottom to top: 20°C, 15°C, 10°C, 5°C, 0°C, and −1.5°C. The suppression of the thermal feature in going from room temperature to −1.5°C is most apparent in the 1− to 10-μs window. In addition, the relatively flat feature of the data, clearly visible at T = −1.5°C from t = 0 to t ≈ 400 ns becomes shorter in going to higher temperatures.

