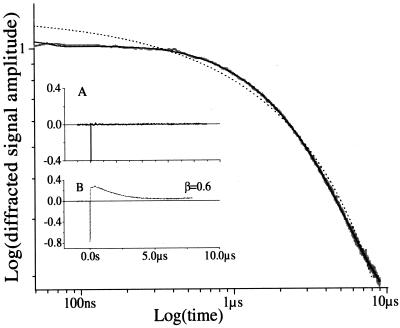
Figure 7.
Comparison of fits to the data with a stretched exponential or exponential relaxation processes. (A) Residuals of the fit to the model of ref. 15 (solid line). (B) Residuals of the fit to the data by using a stretched exponential of β = 0.6, optimized to give the best fit (τ = 5.9 μs).

