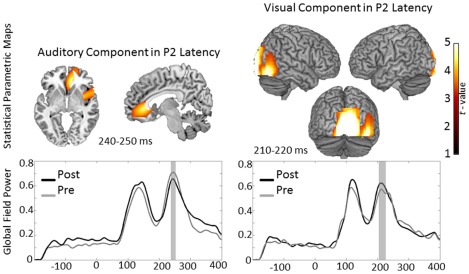
Figure 5. Sagittal and axial view of the statistical Parametric Maps of the peaks found in auditory condition and rendering of the Statistical Parametric Maps of the peaks found in the visual condition in the latency of P2.
Location of the activation in the auditory condition: right Insula, BA 13; right Anterior Cingulate Cortex, BA 24. Location of the activation in the visual condition: right Lingual Gyrus, BA 18. Threshold was AlphaSim corrected at p<0.001 by tanking in to account the voxel peak significance (threshold p<0.001 uncorrected) along with the cluster size (threshold size >84 voxels). Lower Panel shows the grand average global field power of pre- and post-training MEG recording for each condition. The time interval of choice for each condition is marked grey.

