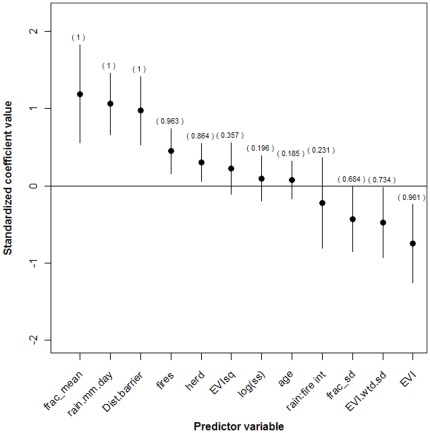
Figure 3. Results of statistical modeling.
Model-averaged (over the set of 4096 candidate regression models) standardized regression coefficients for variables explaining wet season migratory movements in African buffalo. Variable abbreviations: frac_mean = Proportion of home range in woodlands; rain.mm.day = Average rainfall on dry season home range (mm); Dist.barrier.avg = Distance to nearest linear barrier (river, fence, or cultivated area), metres; EVIsq = Square of EVI variable; age = Animal's age at capture (years); fires = Binary variable indicating presence of fires on dry season home range; log(ss) = Number of wet season GPS observations (log-transformed); herd = Size of animal's herd at capture; rain∶fire int = Interaction variable of rainfall and fire presence; EVI.wtd.sd = Standard deviation of EVI variable; EVI = Average EVI value on dry season home range; frac_sd = Standard deviation of frac_mean variable.

