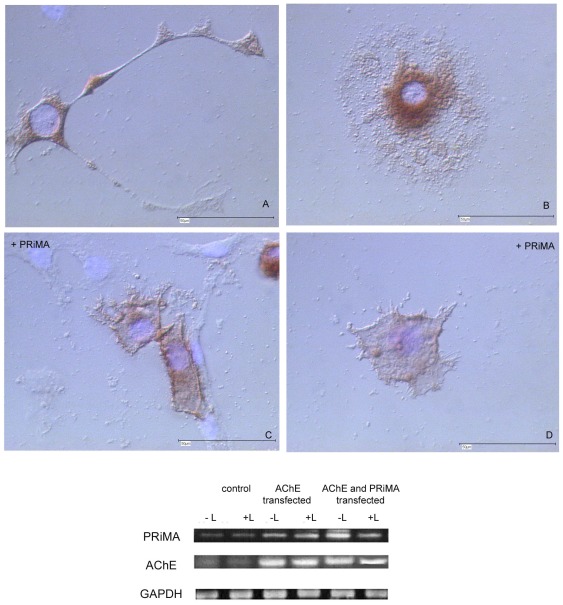
Figure 6. PRiMA overexpression in a stably AChE-transfected R28 cell.
line localizes AChE to cell membrane and changes cell morphology. Note strong AChE activity on membrane of PRiMA transfected cells, with multiple emanating short side processes (C, D), as compared with more diffuse, but still localized AChE expression in control cells (A, B). (A–D) Karnovsky-Roots staining; all cells were grown on laminin-1. Scale bar 50 µm. Fig. 6 (lower). Expression of PRiMA is strongly increased in cells overexpressing AChE, and more so in AChE plus PRiMA co-transfected cells, as detected by RT-PCR. Total RNA of control, of AChE transfected, and of AChE plus PRiMA transfected cells was used for the analyses. Note: GAPDH primers were used as internal control.

