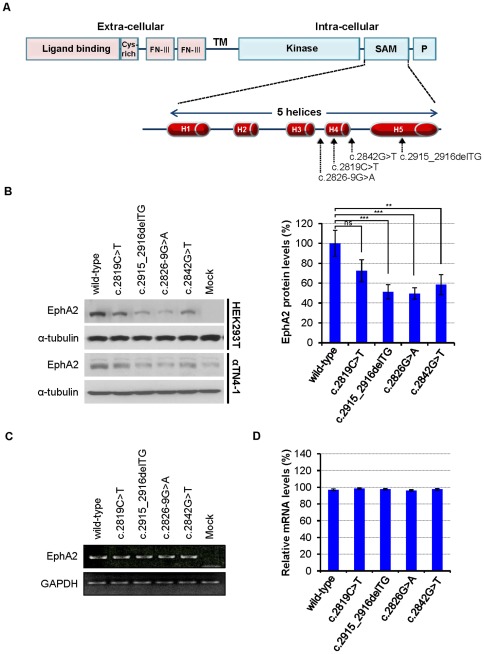
Figure 1. EPHA2 cataract mutations in the SAM domain.
(A) Schematic diagram showing the domains of EPHA2 receptor and the locations of four SAM domain mutations found in human cataracts (c.2819C>T; c.2915_2916delTG; c.2826-9G>A; and c.2842G>T) in the EPHA2 gene. FN-III: fibronectin type-III domain; TM: transmembrane domain; Kinase: protein tyrosine kinase domain; SAM: sterile-α-motif domain; P: PDZ-binding motif. The SAM domain comprises 5 α-hecices (H1–5). (B) Reduction of mutant EPHA2 protein levels in transfected cells expressing EPHA2 mutants. Protein levels of EPHA2 mutants are decreased in both HEK293T and αTN4-1 cells. The blot was reprobed with anti-α-tubulin as a loading control. The graphs represent the quantification of relative band intensity of EphA2 as connected by the levels of α-tubulin from three independent experiments. Total EphA2 protein band intensity was determined using ImageJ software. Mean values are presented with  S.D as indicated. Statistical differences between multiple groups were analyzed using one-way analysis of variance (ANOVA). ***, P<0.001; **, P<0.01; *, P<0.05; and ns, not significant. Values of P<0.05 were considered to be statistically significant. (C, D) No difference between wild-type and mutant EPHA2 genes in transcription levels. (C) Semi-quantitative RT-PCR and (D) Real-time PCR for wild-type and mutant EPHA2 genes were performed using total RNA, isolated from transfected HEK293T cells. GAPDH transcript levels are used as controls. The graphs represent the quantification of western blots from three independent experiments.

