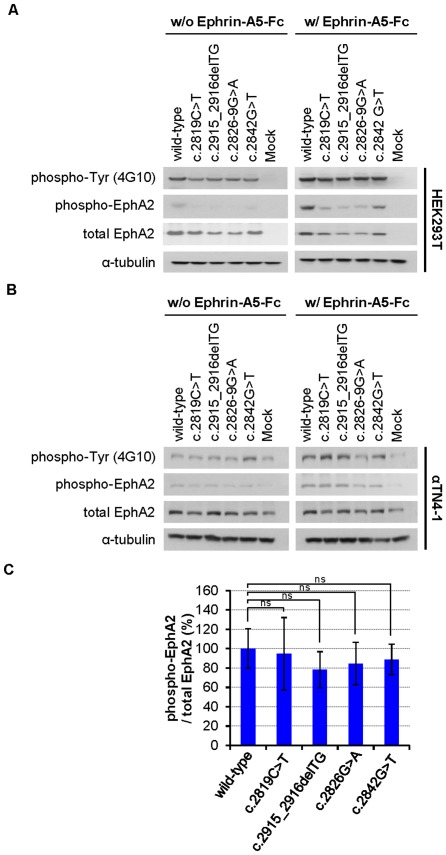
Figure 4. Tyrosine phosphorylation of EPHA2 receptor by ephrin-A5 is not affected by SAM domain mutations.
(A, B) Ephrin-A5 ligand stimulates EPHA2 phosphorylation. HEK293T (A) and αTN4-1 (B) cells were grown to confluence and growth factor-starved for 24 hours. 2 µg/mL cross-linked ephrin-A5-Fc was then added to the starvation media and cell lysates were immunoblotted with indicated antibodies. Western blot analysis was performed as described in the Materials and Methods. The blot was reprobed with anti-α-tubulin as a loading control. (C) The ratios of levels of phospho-EphA2 to total EphA2 are similar between the wild-type and mutant EPHA2 proteins. The graphs show total band intensity of anti-phospho-EphA2 immunoblot to total EphA2 and represent the average of three independent experiments. Quantification of phospho-EphA2 protein/total EphA2 protein levels was performed using ImageJ software. Mean values are presented with  S.D as indicated. Statistical differences between multiple groups were analyzed using one-way analysis of variance (ANOVA). Values of P<0.05 were considered to be statistically significant. ns: No statistically significant difference between the two groups.

