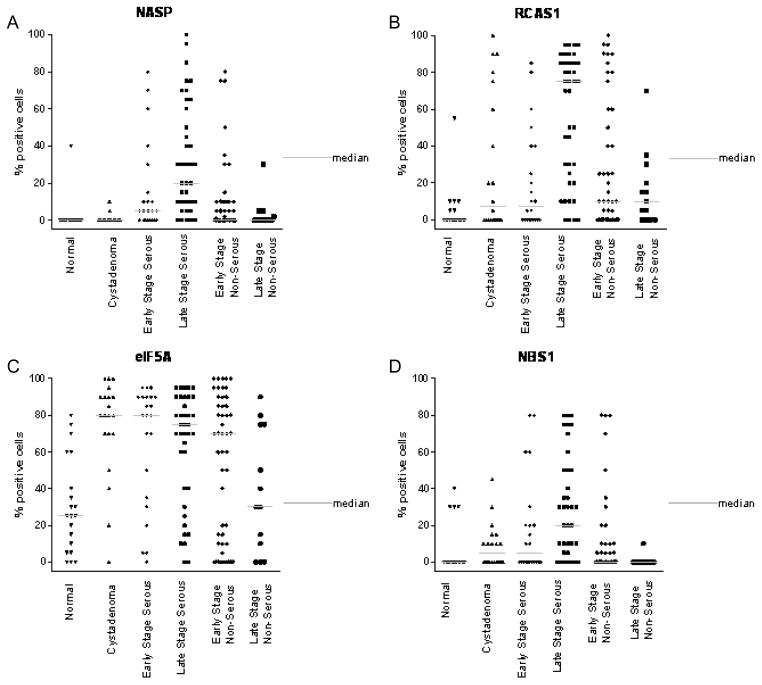
Fig. 3.
Graphical representation of protein expression level obtained by IHC as the percent of cells positively staining for each antigen biomarker. The protein expression of NASP (A), RCAS1 (B), eIF5A (C) and NBS1 (D) in normal (healthy women), serous cystadenoma, early and late stage serous OVCA, early and late stage non-serous OVCA is shown above. The gray bar indicates the median value for each class of tissue sample.

