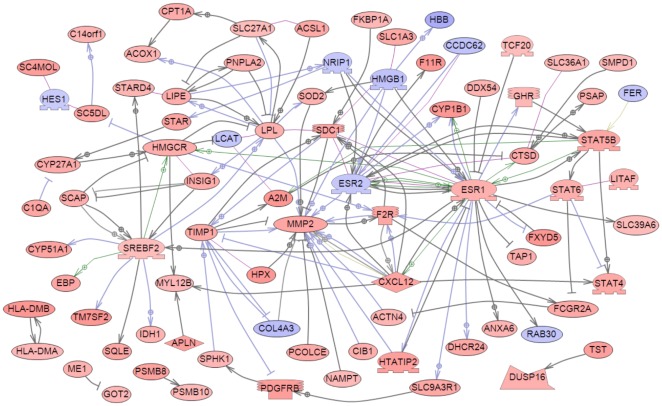
Figure 6. Gene network of known relationships among those genes found to be differentially expressed in Control compared to Vinclozolin-lineage F3 generation granulosa cells.
Network is derived from an un-biased search of literature using Pathway Studio™. Node shapes code: oval and circle – protein; diamond – ligand; irregular polygon – phosphatase; circle/oval on tripod platform – transcription factor; ice cream cone – receptor. Red color represents up-regulated genes, blue color – down-regulated genes, grey rectangles represent cell processes; arrows with plus sign show positive regulation/activation, arrows with minus sign – negative regulation/inhibition. Grey arrows represent regulation, lilac – expression, green – promoter binding, olive – protein modification.

