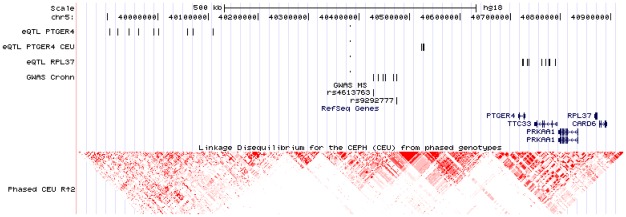
Figure 4. Location of eQTLs of the 5p13.1 region and the SNPs associated to MS and Crohn diseases.
Image from the UCSC browser showing the chr5:39,840,547-40,924,217 (NCBI36/hg18) region. Vertical bars indicate the location of eQTLs and SNPs associated to Crohn or MS in different studies. eQTL PTGER4 are described by Zeller et al.; eQTL PTGER4 CEU are obtained from the correlation of PTGER4 expression in the CEU lymphoblastoid cell lines with the variants of the region; eQTL RPL37 are described by Stranger et al. and Dixon et al.; GWAS Crohn indicate the SNPs associated with the disease in different studies [9], [14], [15], [16]; GWAS MS indicate the SNPs associated with MS. LD plot performed with HapMap data from CEU population.

