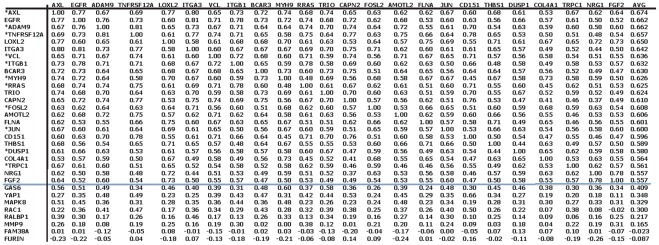
Figure 3. Expression profile cross-correlations of the 32 genes that participate in the interaction networks shown as molecular interaction maps in Figures 11 and 12 .
The right-most column lists the averages for each row. Above the horizontal line are 24 genes (HCCS24) that had expression profile cross-correlation averages greater than 0.50; these 24 genes are shown in red in Figures 11 and 12. Genes marked with an asterisk (*) were also in the HCCS15 gene set (Figure 1). Below the lines are genes that, although they participate in the networks shown in Figures 11 and 12, had expression profile correlations too low to be included in HCCS66 or HCCS24; these genes are shown in black in Figures 11 and 12. (Individual expression profile correlations >0.30 were considered significant.)

