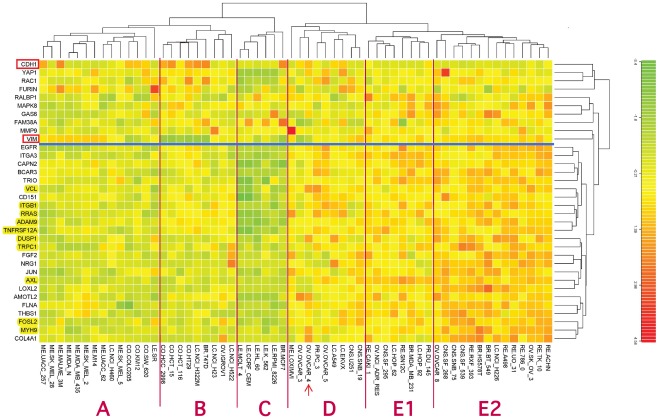
Figure 4. Clustered image map (CIM) of the relative expression of the 32 genes in Figure 3 in each of the NCI-60 cell lines.
In addition, the CIM includes CDH1 (E-cadherin, a marker genes for epithelial character) and VIM (vimentin, a marker genes for mesenchymal character). The CIM image (Euclidean norm, complete linkage) was computed using custom in-house R language code. The genes below the blue line are the 24 genes in high cross-correlation set HCCS24 (above the blue line in Figure 3 and marked red in Figures 11 and 12 ). Genes that were also in HCCS15 (Figure 2) are highlighted in yellow. The vertical red lines help to discern which cell lines of a given tissue type cluster together, which deviate, and which fall into a cluster dominated by a different tissue type. The arrow points to ovarian carcinoma cell line OVCAR4, which was unusual in showing high expression of both CDH1 and VCL.

