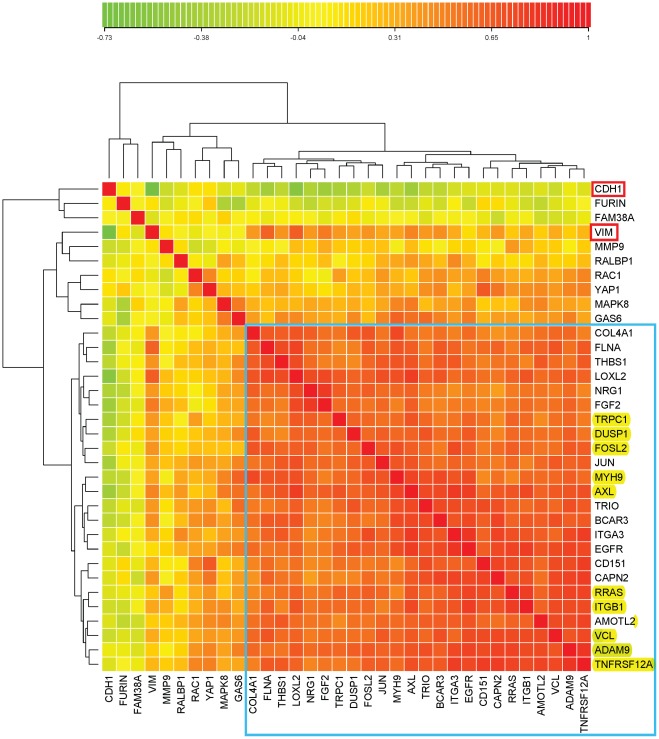
Figure 5. Correlation CIM of the same genes as in Figure 4.
The genes in the blue box are the 24 high cross-correlation HCCS24 genes; these genes correlated significantly with VIM and not with CDH1, showing that they correlate with mesenchymal character. Note however that some genes correlated better than others with VIM: genes such as RAC1 and GAS6, as well as VIM, which failed to meet the strict criteria for inclusion with the HCCS24 genes, nevertheless are seen to be significantly correlated with them. Interestingly, some of the genes that were imperfectly correlated with the HCCS24 genes (i.e., GAS6, MAPK8, YAP1, and RAC1) tend to correlate inversely with VIM; the cell lines that contribute to this effect can be seen in Figure 4 (they include 4 colon lines that express CDH1 but not VIM). The low correlation of FURIN with the HCCS24 genes is attributable to its functioning in stromal rather than tumor cells (Figure 12); the low correlation of FAM38A however remains unexplained.

