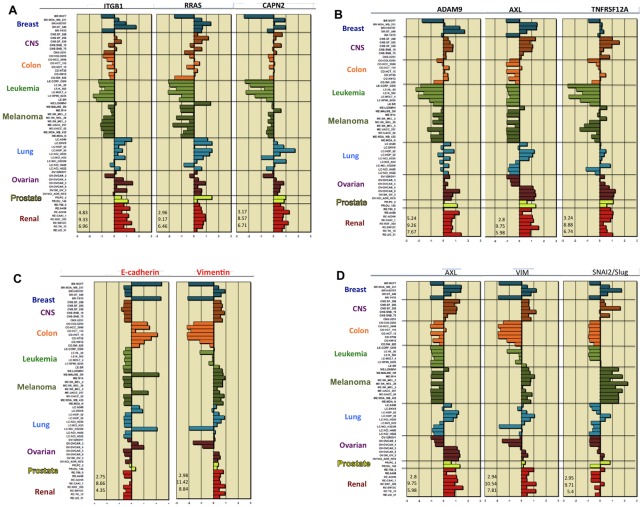
Figure 6. Relative gene expressions for the NCI-60 human tumor cell lines.
Bars to the right show increased expression, bars to the left show decreased expression relative to the expression mean. Each panel shows the lowest, highest and mean expression levels (numbers at the lower left from top to bottom). Expression values are normalized as z-scores (see Methods). The horizontal axes are marked in standard deviations from the mean. (A) Expression profiles for RRAS, ITGB1, and CAPN2. (B) Expression profiles for ADAM9, AXL, and TNFRSF12A. (C) Epithelial and mesenchymal gene expression profiles, indicated by CDH1 (E-cadherin) and VIM (vimentin) respectively, showing their inverse relationships. (D) Comparison of expression profile of migration-related genes, represented by AXL, with that of mesenchymal-related genes, represented by VIM and SNAI2 (Slug).

