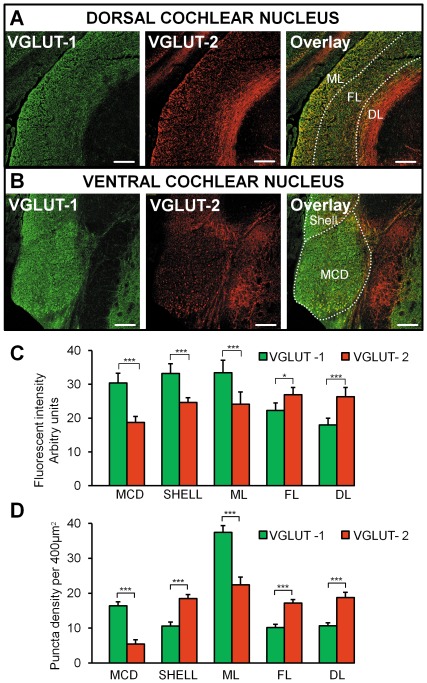
Figure 5. Expression of VGLUT-1 and VGLUT-2 in the DCN and the VCN.
(A) Photomicrographs of VGLUT-1 and VGLUT-2 staining in the DCN with the layers being individually labelled (ML molecular layer, FL fusiform layer, DL deep layer). The overlay shows that VGLUT-1 is mainly present in the ML whereas VGLUT-2 is mainly present in the DL. (C) (B). Photomicrographs of VGLUT-1 and VGLUT-2 staining in the VCN. The overlay shows that VGLUT-1 is mainly expressed in the VCN in comparison to VGLUT-2. Scale bar: 200 µm. All slices are 20 µm thick. (C) Histograms representing the fluorescence intensity of VGLUT-1 and VGLUT-2 in the DCN layers, the MCD and the shell region. * p<0.05, *** P<0.001, NS non significant. (D) Histograms representing the puncta density of VGLUT-1 and VGLUT-2 labelled terminals in the DCN layers, the MCD and the shell region, *** P<0.001. ML: molecular layer; FL: fusiform cell layer; DL: deep layer.

