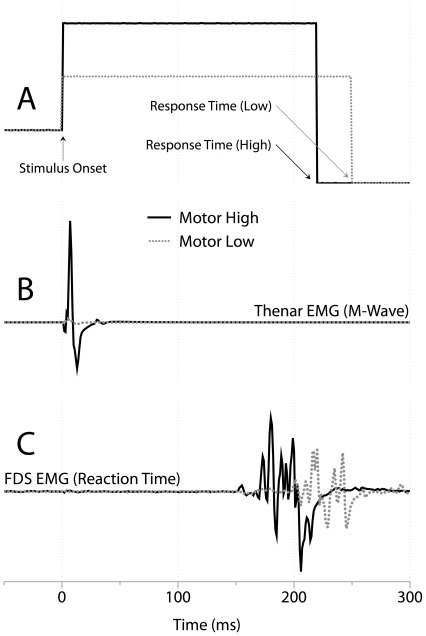
Figure 2. Single trial from a representative subject.
(A) Raw stimulus voltage for each of the HIGH intensity (dark black line) and LOW intensity (dashed grey line) stimulus. Upwards deflection indicates stimulus onset and downwards deflection indicates response time for that trial. (B) The resulting raw M-Wave EMG collected from the thenar eminance of the stimulated hand. (C) The raw EMG collected from the flexor digitorum superficialis of the button-pressing limb.

