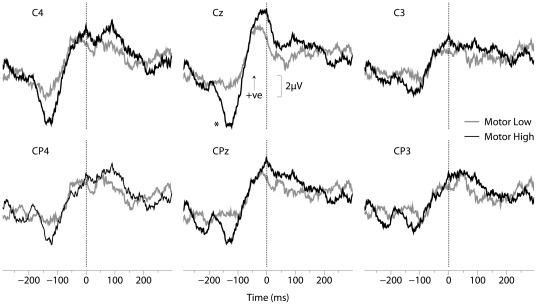
Figure 5. Grand averaged ERPs from six electrode sites.
ERPs are averaged relative to response time. The response time is denoted by time = 0. The PreN-PreP amplitude (between 130 ms to 35 ms prior to response time) is significantly greater following the HIGH intensity stimulus (dark black line) compared to the LOW intensity stimulus (grey line) in the Cz electrode.

