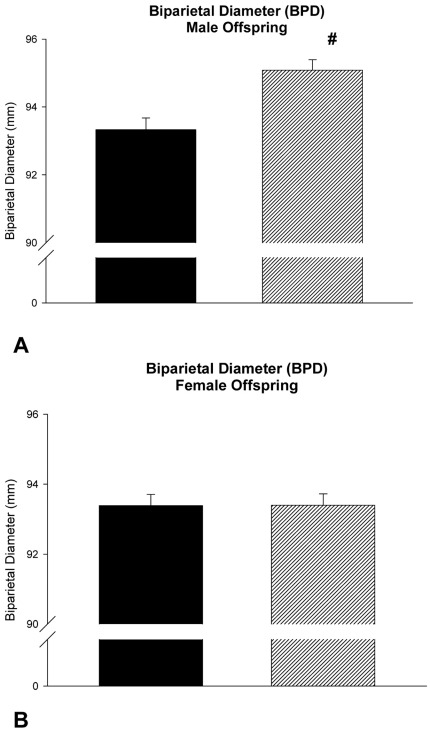
Figure 1. Biparietal diameter of male (A) and female (B) offspring in relationship to paternal BMI.
Ultrasound examination was done in average at gestational day 266.8. Black Bar: Paternal BMI below median; Hatched Bar: Paternal BMI above median. #: p = 0.008 versus male offspring of fathers with a BMI below the median of all paternal BMI data of the cohort; Data are given as mean +/− SEM.

