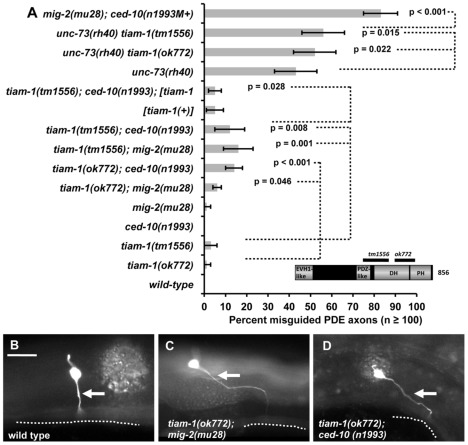
Figure 1. TIAM-1 acts with the Rac GTPases in axon pathfinding.
A) A graph representing PDE axon pathfinding defects (X axis) in different genotypes (Y axis). At least 100 PDE neurons were scored, and p value significance was determined by Fisher's exact analysis. [tiam-1(+)] indicates a transgene that harbors a wild-type genomic copy of the tiam-1 locus on fosmid clone WRM0633ch01. The error bars represent 2× standard error of the proportion in each direction. M+ indicates that the genotype had wild-type maternal gene function. The inset is a model of the predicted TIAM-1 isoform A molecule (856 amino acid residues) showing the regions of the molecule missing in two deletion alleles. Unless otherwise noted, all backgrounds are wild-type. p value significance as determined by Fisher Exact Analysis is shown. Dashed lines indicate comparisons between genotypes not marked with a p value to those marked with p values. (B–D) Fluorescent micrographs of osm-6::gfp in the PDE neurons of young adults. In all micrographs, dorsal is up and anterior is to the left. The arrows point to axons, which are misguided in mutants in (B) and (D). The ventral nerve cord is represented by a dashed line. The scale bar in (B) represents 5 µm for (B–D).

