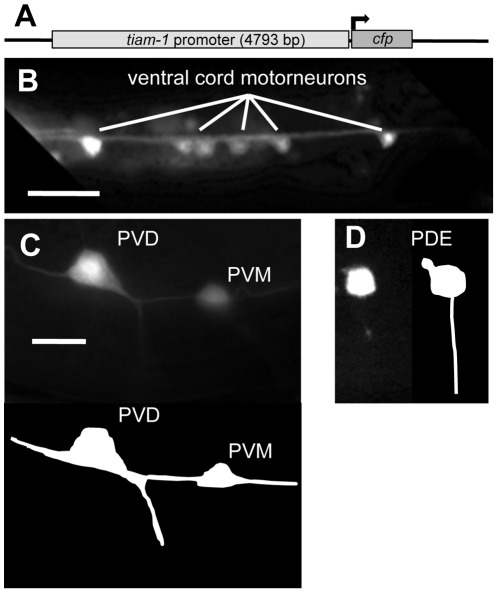
Figure 2. The tiam-1 promoter drives expression in the nervous system.
A) A diagram of the tiam-1 promoter::cfp transgene. The tiam-1 promoter included 4793 bp upstream of the tiam-1 A cDNA initiator codon. (B–D) Fluorescent micrographs of young adults harboring tiam-1p::cfp. In all micrographs, dorsal is up and anterior is to the left. B) tiam-1p::cfp expression in ventral cord motor neurons (ventral aspect). C) Expression in the post-deirid ganglion neurons PVD and PVM (lateral aspect) The diagram below depicts the positions of the neurons in the micrograph. D) Expression in the PDE neuron (lateral aspect), with a depiction to the right. The scale bar in (B) represents 10 µm, and the scale bar in (C) represents 2 µm for (C–D).

