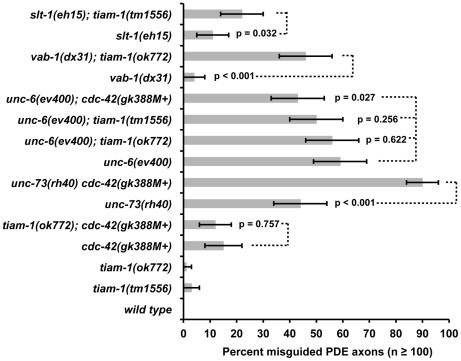
Figure 7. tiam-1 and cdc-42 interactions with axon guidance mutations.
A graph representing PDE axon pathfinding defects (X axis) in different genotypes (Y axis). At least 100 PDE neurons were scored, and p value significance was determined by Fisher's exact analysis. The error bars represent 2× standard error of the proportion in each direction. M+ indicates that the genotype had wild-type maternal gene function. Dashed lines indicate comparisons between genotypes not marked with a p value to those marked with p values.

