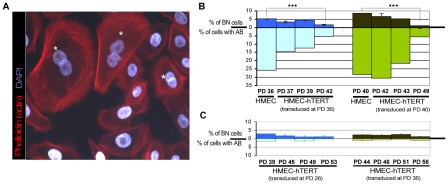
Figure 4. Quantification of anaphase bridges and binucleates in non-transduced and hTERT-transduced HMECs.
(A) Texas Red-X phalloidin labelling of actin filaments and DNA counterstaining with DAPI of non-transduced HMECs. White asterisks highlight those binucleated cells. (B) Analysis for the presence of binucleated cells (BN; upper bars) and anaphase bridges (AB; lower bars) in non-transduced HMECs and at different PDs immediately after transducing cells with hTERT. Two independent cell transduction experiments were performed (transduction at PD36, in blue and at PD40, in green). (C) The same analysis was performed after HMEC-hTERT cells were passaged more than 8 PDs after transduction. Again, two independent transduction experiments were performed (transduction at PD26, in blue and at PD36, in green).

