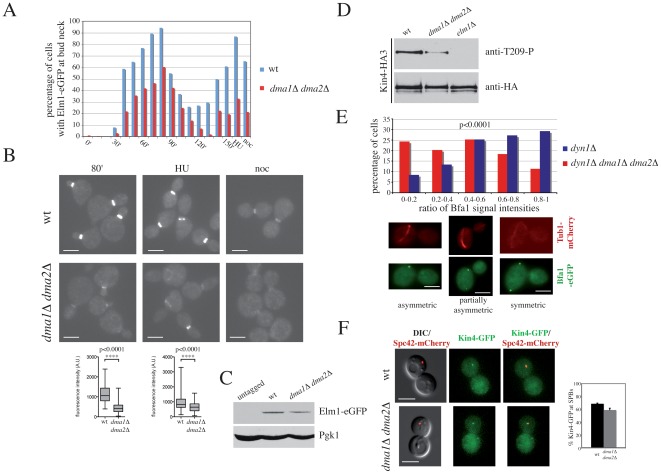
Figure 6. Dma proteins control Elm1 recruitment to the bud neck and Kin4 activation.
A, B: Wild type (ySP8813) and dma1Δ dma2Δ (ySP8829) cells expressing Elm1-eGFP were arrested in G1 by alpha factor and released into the cell cycle at 25°C (time 0). The culture was split in three parts: one part was left untreated, while the other two were incubated for 150 minutes with HU (120 mM) and nocodazole (15 µg/ml), respectively. Cell samples from the untreated culture were withdrawn at the indicated times for FACS analysis of DNA contents (Figure S6A) and to score budding, nuclear division and bud neck localization of Elm1-eGFP (A and Figure S6B). Representative micrographs were taken for all cultures (B). Fluorescence intensity was quantified in 100 cells for each strain at time 80′ for untreated cells and 150′ for HU-treated cells, and values were plotted in the bottom graphs. Scale bars: 5 µm. C: Western blot with anti-GFP antibodies of cell extracts from untagged cells or wild type (ySP8813) and dma1Δ dma2Δ (ySP8829) cells expressing Elm1-eGFP. Pgk1: loading control. D: HA-tagged Kin4 (Kin4-HA3) was immunoprecipitated with anti-HA beads from extracts derived from cycling cultures of wild type (ySP8986), dma1Δ dma2Δ (ySP8987) and elm1Δ (ySP8997) cells. Immunoprecipitates were subjected to western blot analysis with anti-T209-P [38] and anti-HA antibodies. E: dyn1Δ (ySP9493) and dyn1Δ dma1Δ dma2Δ (ySP9492) cells expressing Bfa1-eGFP and Tub1-mCherry were grown at 25°C and then shifted to 14°C for 16 hours. Fluorescence intensities of Bfa1-eGFP signals at the two poles of misaligned spindles were quantified on max projected images and plotted as ratios between the less and the most fluorescent signal (ratio = 0: complete asymmetry; ratio = 1: complete symmetry; n>98). Scale bars: 5 µm. F: Wild type (ySP8995) and dma1Δ dma2Δ (ySP8994) cells expressing Kin4-GFP and Spc42-mCherry were arrested in mitosis with nocodazole. Z-projected images of representative cells with Kin4-GFP co-localizing with Spc42-mCherry are shown. The histograms on the right side show the quantification of data with standard error bars from three independent repeats. 150–250 cells were scored for each strain in each experiment. Scale bars: 5 µm.

