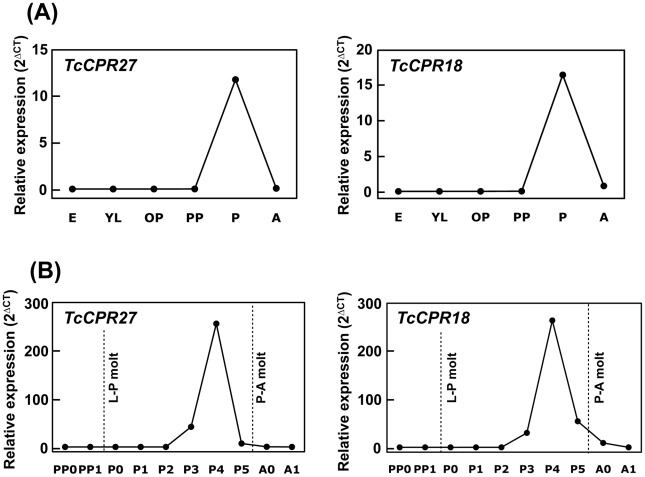
Figure 3. Expression profiles of TcCPR27 and TcCPR18 genes during development.
(A) To analyze the expression profiles of TcCPR27 and TcCPR18 during development, real-time PCR experiments were done using total RNA extracted from five whole insects at different developmental stages (embryo to adult). Both genes were highly expressed at the pupal stage. (B) To analyze more rigorously the expression patterns of these genes, the stages analyzed were expanded between the early pharate pupal and young adult stages. The transcript levels of both genes dramatically increased at the pharate adult stage and declined rapidly thereafter. E, embryos; YL, young larvae; ML, mature larvae; PP, pharate pupae; P, pupae; A, adults; PP0, day 0–1 pharate pupae; PP1, day 1–2 pharate pupae; P0, day 0 pupae; P1, day 1 pupae, P2, day 2 pupae; P3, day 3 pupae; P4, day 4 pupae (pharate adults); P5, day 5 pupae (pharate adults); A0, day 0 adults; A1, day 7 adults. Expression levels for TcCPR27 and TcCPR18 are presented relative to the levels of expression in embryos (E) or 0–1 d old pharate pupae (PP0). The transcript levels of the T. castaneum ribosomal protein S6 (rpS6) were measured to normalize for differences between samples in the concentrations of cDNA templates.

