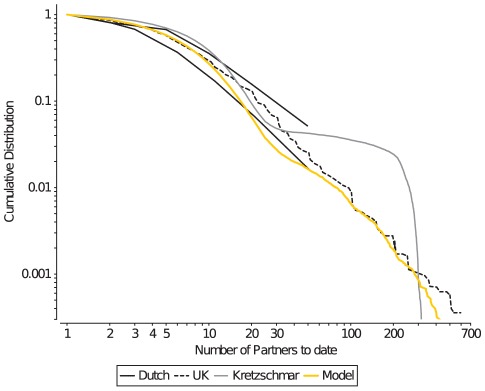
Figure 1. Cumulative plots of the lifetime number of partnerships (CLNP).
Empirical data on the CLNP is available as a range for the Dutch sexual survey data (black solid lines), and as absolute numbers for the UK survey data (black dashed line). The Kretzschmar model (gray lines) struggles in reproducing the powerlaw-like distribution of the survey data, whereas the current model can closely reproduce such a distribution (orange lines).

