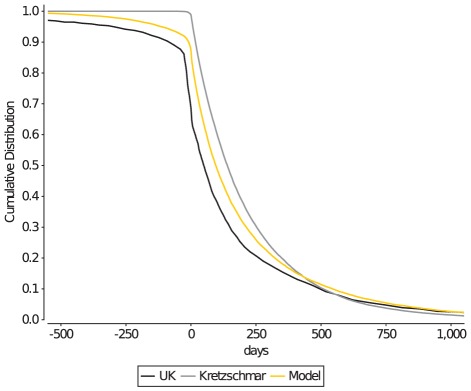
Figure 6. Gap length, i.e. the time between the two most recent partnerships.
Negative gaps indicate overlapping partnerships, whereas positive gaps indicate the time it takes to acquire a new partner. The current model (orange line) does not fully match the UK survey data (black line). It would require a higher level of transitional concurrency in the simulated population, but one that is incompatible with the Dutch survey data on Fig. 6.

