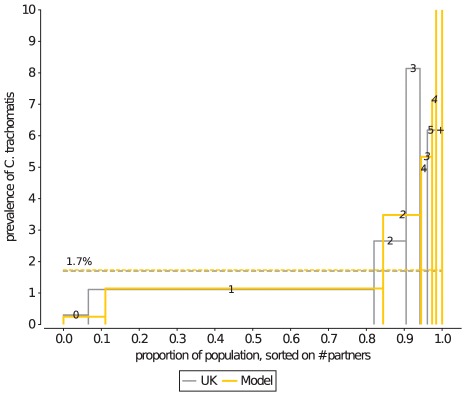
Figure 8. The distribution of Ct prevalence, stratified by number of partners in the last year.
Although the current model is fitted to the Dutch sexual contact network, the Ct prevalence distribution for those with 0, 1, and 2 partners in the last year corresponds well to the UK survey data. At higher levels of sexual activity, the model underestimates the Ct prevalence in individuals with an intermediate level sexual activity, and overestimates the Ct prevalence of the core group. The Ct prevalence in the highest category for the model is 22%. The Ct distribution shown here is the average of 15 years of sampling from 10 instances of the sexual contact network.

