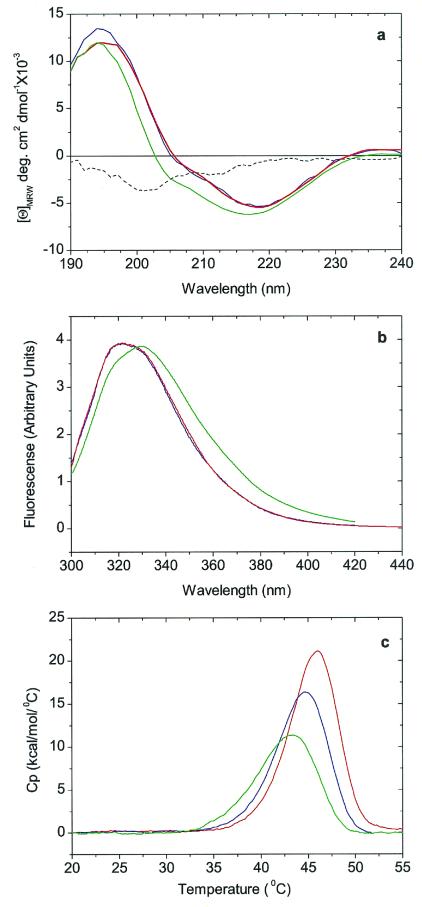
Figure 2.
Conformation and stability studies of HGD, R58H, and R36S proteins. (a) Far-UV CD spectra. The spectra of HGD (blue) and R58H (red) are almost identical, whereas the spectrum of R36S (green) has an additional contribution from a band of negative ellipticity centered at 200 nm. This band is more readily seen in the difference spectrum R36S minus wild type (dashed black line). (b) Fluorescence emission spectra. The spectrum of R58H (red) protein is almost identical to that of HGD (blue), whereas that of R36S (green) shows a more open structure (17), possibly caused by the exposure of Trp-42, which is close to Ser-36 (7). The spectra are normalized with respect to protein concentration. (c) DSC. The thermal transitions shown are only partially reversible and hence preclude an equilibrium thermodynamic analysis. However, based on the apparent melting temperature, the stabilities of the HGD (blue), R58H (red), and R36S (green) proteins are very similar.

