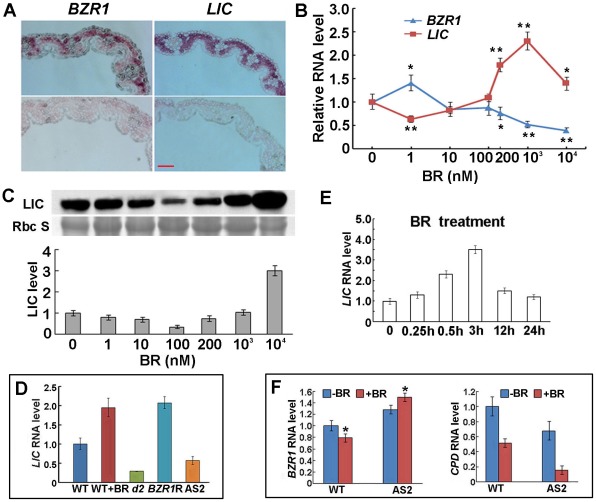
Figure 6. LIC and BZR1 expression patterns and their responses to BR.
(A) RNA in situ expression of LIC and BZR1 on the abaxial and adaxial sides of leaves (the bottom panel represents the negative control with sense probes). Bar = 10 µm. (B) LIC and BZR1 transcriptional expression response to various concentrations of BR. Data are mean ± SD (n = 5). *P<0.05 and **P<0.01 compared with no BR treatment as determined by Student's t test. (C) Immunoblotting to show the response of LIC protein expression to BR. LIC was repressed by low concentrations of BR (<100 nM) and induced by high concentrations of BR (>200 nM). Coomassie Blue staining served as the loading control. The levels of LIC were calculated after normalization against the intensity of Coomassie Blue staining in 3 replicated experiments, and the quantified values are shown beneath the gel images. Data are mean ± SE. (D) LIC transcriptional expression with BR treatment in wild-type (WT) and BR-deficient mutant d2 and BZR1 RNAi transgenic lines (BZR1R). LIC antisense line 2 (AS2) was a control. Data are mean ± SD (n = 3). (E) Time course response of transcription expression of LIC to BR (1 µM). LIC was rapidly induced by BR. Data are mean ± SD (n = 3). (F) BZR1 and CPD transcriptional response to BR treatment in the wild type and LIC antisense lines. For BZR1, data are mean ± SD (n = 5). *P<0.05, compared with no BR treatment. For CPD, Data are mean ± SD (n = 3).

