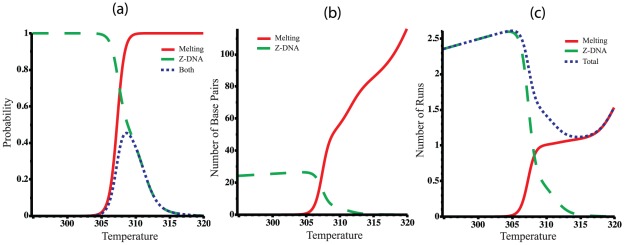
Figure 4. Various thermodynamic equilibrium properties of competing denaturation and B-Z transitions in the pBR322 sequence are shown as functions of temperature.
All calculations were performed at  : (a) The probability of each transition
  ,
,  , are shown, as is the probability
  of both transitions occurring simultaneously; (b) the average number of transformed base pairs
  is shown for each transition type; (c) the average number of runs
  are plotted for each transition type. The average total number of runs
  also is shown.

