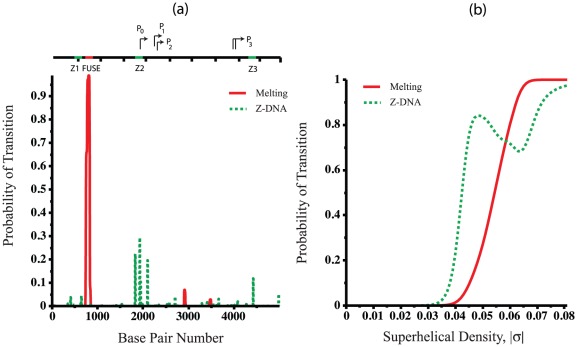
Figure 6. Transition behavior for human c-myc gene.
(a) The transition profile calculated with BDZtrans for the human c-myc gene at  = −0.06 and T = 310 K. The upper panel located the promoters, the three AluI fragments, and the FUSE element. (b) Probability of denaturation and the B-Z transition as a function of superhelical density
  at T = 310 K.

